The Outer Sunset Real Estate Pricing Trends 2020–2025 reveal a resilient neighborhood that has steadily climbed in value, even amid shifting interest rates and changing buyer preferences.
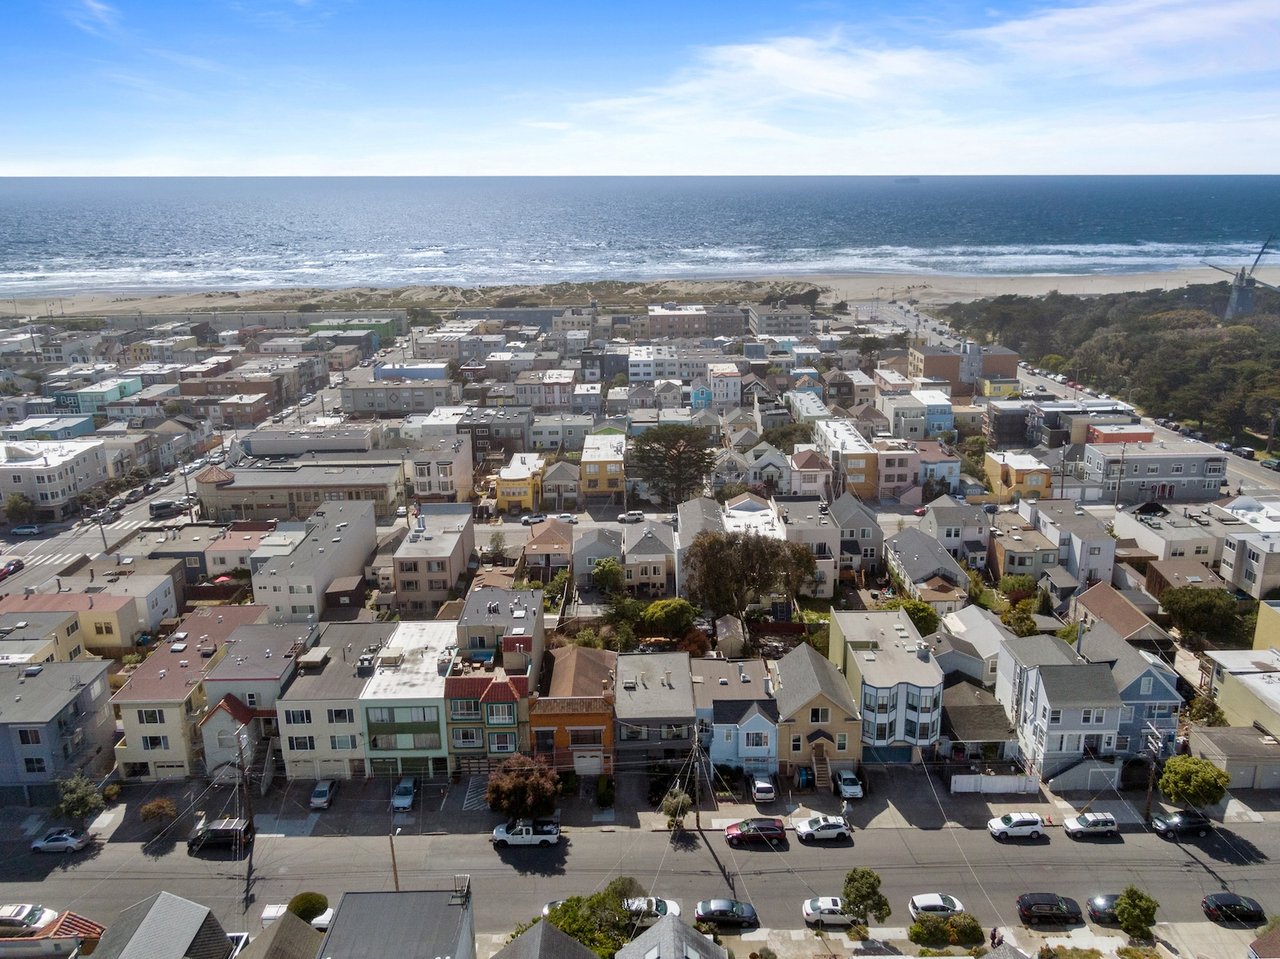
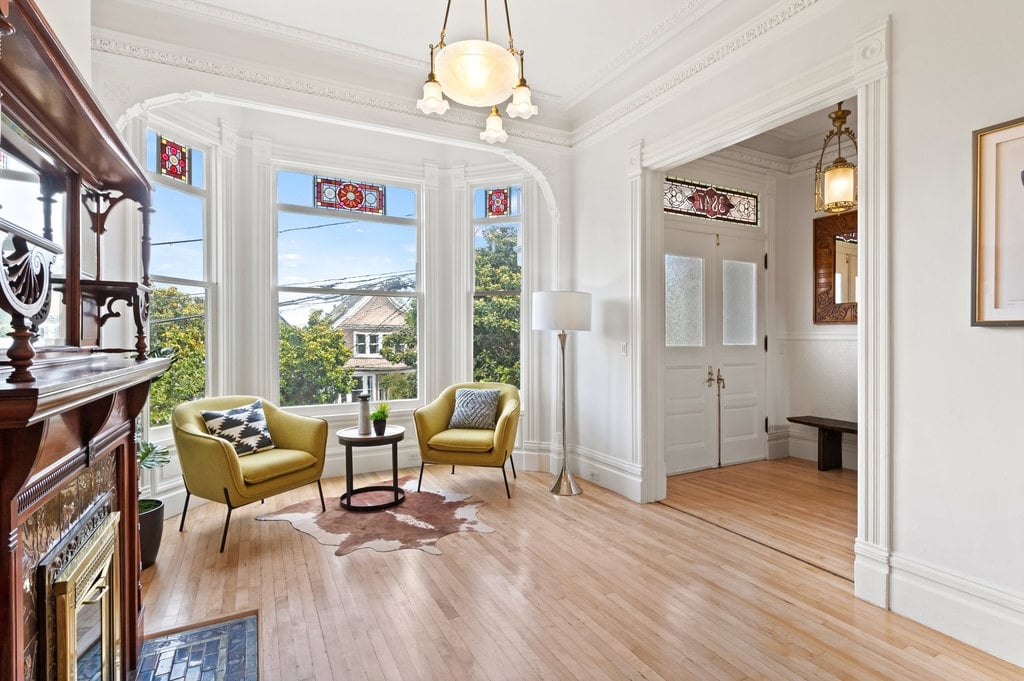
Nestled between Golden Gate Park and Ocean Beach, the Outer Sunset offers a laid-back coastal vibe, charming older homes, and a growing number of modern renovations.
Let’s unpack year-by-year pricing shifts, the forces behind them, and what you, as a buyer or seller, can expect next.
Market Overview
Since 2020, Outer Sunset has transformed from an under-the-radar enclave to one of San Francisco’s most sought-after pockets.
Here’s how median sale prices have evolved:
Year |
Median Sale Price |
YoY Change |
|
2020 |
$1,200,000 |
— |
|
2021 |
$1,315,000 |
+9.6% |
|
2022 |
$1,425,000 |
+8.4% |
|
2023 |
$1,515,000 |
+6.4% |
|
2024 |
$1,555,000 |
+2.6% |
|
2025 |
$1,600,000 |
+2.9% |
Preliminary as of May 2025
Over five years, Outer Sunset’s median sale price climbed approximately 33%, outpacing many San Francisco neighborhoods. While the pace of growth slowed in 2024–2025, reflecting the impact of rising mortgage rates and broader economic headwinds, the coastal community’s appeal remains strong.
Year-by-Year Pricing Trends
2020–2021: Post-Pandemic Boom
-
Drivers: Remote work surge, desire for single-family homes with outdoor space, and historically low interest rates.
-
Result: Nearly 10% jump in median prices as buyers sought quieter neighborhoods and proximity to the beach.
2021–2022: Continued Momentum
-
Drivers: Ongoing remote/hybrid work models, limited supply in nearby Richmond and Sunset districts.
-
Result: Median values climbed another 8.4%, with homes selling in an average of 15 days.
2022–2023: Supply Catch-Up
-
Drivers: A modest uptick in new listings as spec builders and owners responded to high prices.
-
Result: Growth moderated to 6.4%, with an average time on the market of 18 days.
2023–2024: Interest Rate Headwinds
-
Drivers: Federal rate hikes, affordability challenges, and competition from suburban markets.
-
Result: Price growth slowed to 2.6%, though sale-to-list ratios remained near 102%.
2024–2025: Stabilization & Selective Demand
-
Drivers: Rates are plateauing, buyer fatigue is evident at top price bands, yet there remains a continued appeal for turnkey homes near transit corridors, such as the Judah Street lines.
-
Result: Prices ticked up 2.9% year-over-year, and average days on market hovered at 20 days.
Still struggling to interpret preliminary title reports? → Read this.
What Factors Are Driving Price Changes
-
Remote and Hybrid Work: Home offices and flexible schedules continue to drive demand for neighborhoods with more interior and outdoor space.
-
Coastal Lifestyle: Easy access to Ocean Beach, Golden Gate Park, and local surf culture adds a lifestyle premium.
-
Transit & Walkability: Proximity to the N-Judah Muni line and lively Judah/Morse corridor supports convenience-seeking buyers.
-
Limited New Construction: Strict zoning and preservation of Victorian and cottage architecture cap inventory, fueling competition.
-
Investment & Renovation: A wave of cosmetic-fix purchases and high-end remodels in 2021–2022 indicates that buyers are willing to pay for turnkey properties.
What This Means for Buyers
-
Budget Planning: Expect to allocate at least $1.5 million for a solidly located, move–in–ready home.
-
Handy with Offers: Competitive bids on well-staged properties often exceed asking by 3–5%.
-
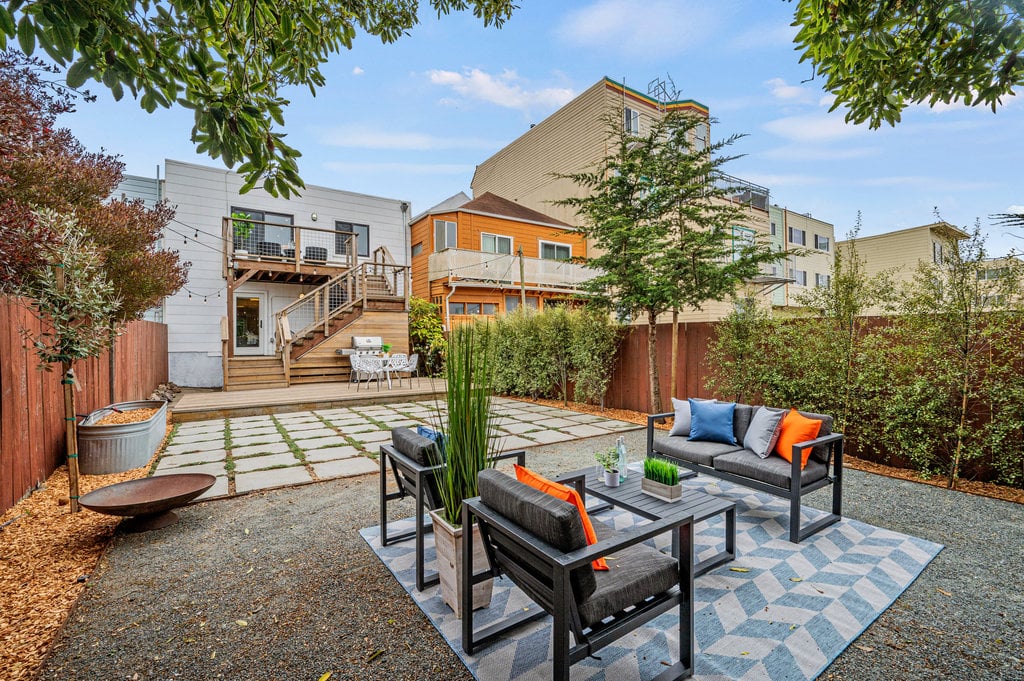
Value-Add Opportunities: Consider homes needing light cosmetic updates for potential equity gains.
-
Financing Caution: Lock in rates quickly in a fluctuating rate environment; partner with lenders experienced in San Francisco markets.
Are you thinking like a buyer? 👉 Find out
What This Means for Sellers
-
Pricing Strategy: Homes priced within 2% of market comps typically generate showings and multiple offers within the first 10 days.
-
Pre-Listing Prep: Professional staging, updated landscaping, and repainting can boost sale price by up to 8%.
-
Timing: The late spring and early summer periods exhibit the highest buyer turnout, making May to July an ideal time for listing.
-
Local Marketing: Emphasize walk score, transit access, and coastal amenities in online listings to maximize appeal and attract potential buyers.
Get a free seller’s guide →Download Your Outer Sunset Seller’s Guide.
Comparing Outer Sunset to Neighboring Districts
Neighborhood |
5-Year Growth |
Median 2025 Price |
Avg. DOM |
|
Outer Sunset |
+33% |
$1,600,000 |
20 |
|
Inner Sunset |
+28% |
$1,850,000 |
18 |
|
Richmond District |
+25% |
$1,475,000 |
22 |
|
Parkside |
+19% |
$1,608,000 |
13 |
While Inner Sunset commands higher prices, Outer Sunset offers a balance of affordability relative to coastal access and has outperformed Richmond in recent years.
Forecast: 2025–2026
-
Modest Growth: Anticipate 3–4% price appreciation as interest rates stabilize and inventory remains constrained.
-
Buyer Segmentation: Entry-level buyers may gravitate toward properties that require minor updates; move–in–ready homes will command higher premiums.
-
Transit-Oriented Demand: Renovated condos and multi-unit buildings near Judah and Taraval corridors will see heightened interest.
-
Sustainability & Resilience: Green home features—such as solar panels and energy-efficient upgrades—will increasingly influence buyer decisions.
Explore current Outer Sunset listings → Outer Sunset Homes For Sale.
Final Thoughts
Buying in the Outer Sunset is a significant decision, but its coastal charm and growing value make it a gratifying experience. With the right strategy and a sharp advocate on your side, you’ll navigate these pricing trends with confidence and clarity.
Frequently Asked Questions
What were the outer-sunset-real-estate-pricing-trends-2020-2025 in San Francisco’s Outer Sunset?
Between 2020 and 2025, the Outer Sunset saw median home prices rise from $1.2 M to $1.6 M—a 33% increase—driven by beachfront living demand, Noriega Street’s vibrant shops, and easy access to the N-Judah Muni line.
How do Outer Sunset real estate pricing trends 2020 – 2025 California compare to other Bay Area coastal markets?
While many California beach neighborhoods experienced double-digit gains, the Outer Sunset’s growth slightly outpaced its local peers, thanks to its combination of walkable retail corridors and preserved Victorian-style homes.
Why did prices climb so quickly in the Outer Sunset from 2020 to 2025?
Key drivers included the surge in remote work, which prompted buyers to seek homes with gardens or bonus rooms, limited new construction due to city zoning laws, and the unique lifestyle premium of living steps from Ocean Beach.
Who benefits most from understanding outer-sunset-real-estate-pricing-trends-2020-2025 insights?
First-time buyers, move-up families, and investors comparing Outer Sunset with neighborhoods like Parkside or Outer Richmond will all gain actionable guidance from these trends.
Who benefits most from these pricing insights?
Whether you’re a first-time buyer seeking a value-add fixer-upper, a seller timing the market for maximum return, or an investor comparing Outer Sunset with Parkside or Outer Richmond, these trends offer actionable guidance.
👉 Contact Oliver Burgelman today to schedule a private consultation and start your search
Oliver Burgelman
📞 415.244.5846
🌐 sfresidential.com